In this post, Jason Noble, Academy’s Chief Technology Officer, explains the design of highly relevant CTO KPIs and shows you how to a) track them and, more importantly, b) use them to improve performance.
Now, the odds are that you’re either a CTO in a start-up or fast-growing company or soon to become one. That implies a more hands-on approach. So the key performance metrics such as CSAT, Churn rate, CLTV, and similar are, perhaps, not exactly your primary interest. We will, however, briefly explain some of those also.
But first, let’s focus on your primary issue at this point and that is getting those KPIs that are most relevant to your organisation at its current stage of development.
Key CTO KPIs in Start-Ups and Fast-Growth Companies
Productivity is best measured if we frame the metrics inside the Cost-Quality-Time Triangle. Any change in the development process will have an impact on one of these factors.
But first, word of caution. If you apply KPIs to the technology team’s output, you must understand their potential impact. You can easily affect morale and, consequently, decrease productivity.
That said, you should use these metrics as tools for growth and learning only. They are not meant to serve any kind of repressive purpose (eg, trying to get more done with fewer people).
As a rule of thumb, KPIs for technology teams will revolve around one of the three corners of the triangle. Hence, by focusing on one segment, you use the metric to focus on and improve that specific area. As a result, you are not overstressing remaining factors while allowing the team to improve rather than destabilise outputs.
1. TIME
1.1 Story issues/questions reduction
What you, ultimately, want to see is a decreasing number of issues and/or questions during the sprint. Raised issues affect the speed and might indicate that you need to redefine the story.
1.2 Bug-fixing/development time ratio
FORMULA: The percentage of time spent on bug fixing versus development time.
This KPI allows the CTO to monitor the ratio and prevent a negative impact on output. For instance, when engineers are too focused on the output speed, they might neglect basic principles and rush the code test, falsely believing that it helps ship the code much faster.
1.3 Story cycle time
It is, basically, the time it takes to close a story once you open it.
If you find this metric rising, it could be either due to blockers that arise during the sprint or because there are too many open stories. The simplest fix is to apply the work-in-progress limit. This speeds up the cycle time of individual stories and, therefore, improves the overall workflow.
1.4 The average time of the story’s blocked status
If you suspect this to be longer than optimal, check for possible communication breakdown and/or improve the story.
Development teams will not worry about the time taken to build or deploy code as this happens automatically. This is true but as a leader, you need to consider if your engineers idle for too long due to over-complicated deployments into an environment.
So do try to assess how much of their productive day is being lost or wasted whilst waiting. If you find such fluctuations, look at the reasons for the slowdowns and see how they can be improved.
2. COST
2.1 Cost per story point per week
FORMULA: Developer cost divided by the story points.
Often, the easiest way to increase the team’s velocity will be to increase the number of resources in the team developers, testers, devops etc. This will allow more work to flow, but it will inevitably incur additional costs.
As a technical leader, it is your job to balance the team output versus the cost and this KPI will give you a benchmark so you can recognise the tipping point.
2.2 The percentage of non-used features
FORMULA: Percentage of features used in production x Number of days after release.
By tracking this metric, you will learn how to improve your prioritisation process.
The logic behind it is simple: the fewer deployed but not used features mean that the overall cost of product development goes down.
2.3 Throughput per sprint
In other words, how much work is actually being done? Naturally, you want to monitor this specific metric over time.
2.4 Average compile time
Time spent on compiling is, essentially, a wasted engineering time. Therefore, see how you can improve the build process either by having optimal resources or special tools. Also, ensure that you maintain a lean compile and deployment cycle.
3. QUALITY
In other words, quality engineering metrics.
3.1 Bug fixes per sprint
FORMULA: Average number of bug fixes per sprint.
To build up your quality more efficiently, you should address any code that undergoes multiple testing and bug-fixing cycles. This will not only affect your delivery speed but also the overall quality of your team’s work.
3.2 Incidents per deployment period
FORMULA: The number of incidents in live per deployment time period.
Tracking incidents, especially P1s and P2s, and being able to track them back to the deployment is a key way of creating good quality feedback loops.
3.3 Codebase coverage
If you measure the code executed via automation tests and get 100%, it may give you a false sense of confidence that your code is completely tested. There is a high probability that too much effort has been put into the testing automation for the return on investment.
You must, therefore, find the correct success measure for your business considering its current state of growth.
HINT: over 90% is generally considered as good.
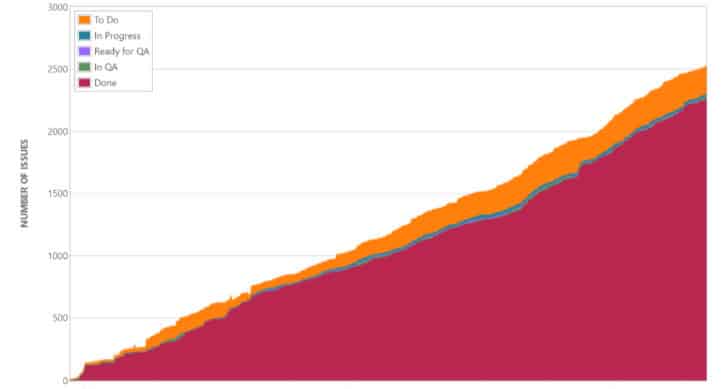
Backlog Monitoring
If you see your backlog growing, you either need to hire more developers or improve the efficiency of your team. That, of course, assumes that the backlog is free of trash.
Use your CTO dashboard to visualise the backlog like in this example:
Additional CTO KPIs and Metrics
1. Customer Satisfaction (CSAT) – Measures customer satisfaction with technology products/services. This KPI is more used by enterprise or Group CTOs.
2. Churn Rate – Measures customer attrition rate over a specific period. It is commonly used in conjunction with a Net Promoter Score that measures customers’ loyalty to the company. For tech-oriented companies, these scores can indirectly show how well the market adopts the technology. Low scores, therefore, may indicate the need for change.
3. System Uptime, Load Time and Reliability – Measures the operational efficiency which is fundamental for user trust.
4. Time-to-Market – Measures the speed at which new technology products or updates are brought to market, which is critical for competitiveness and responsiveness to market demands.
5. Technical Debt – Managing technical debt is essential for long-term sustainability and maintaining development agility.
6. Scalability – Assessing the ability to handle increased load or demand is crucial for accommodating business growth and maintaining performance.
7. Release Frequency and Lead Time – Measures development and deployment efficiency, allowing for quicker responses to market needs.
8. Technology ROI (Return on Investment) – Measures the financial impact of technology investments, providing insights into cost-effectiveness.
When used correctly, all these KPIs guide strategic decisions, inform improvements and ensure that technology initiatives align with organisational goals. So be careful with any rollout to avoid affecting team morale. Instead, use metrics to help your developers improve their skills.